Current Teaching
Fall 2017, ECON 4531, Labor Economics
Office: Hanson Hall 3-107
Office Hours: Thursday 2:30-4:30 pm or by appointment
Email: fazil001 at umn dot edu
Please use the moodle site for updates about the course. Main textbook (required) is Labor Economics, 7th Edition by George Borjas. The Natural Survival of Work, by Pierre Cahuc and Andre Zylberberg, is a supplementary book to learn the policies to deal with unemployment. Mastering Metrics, by Joshua D. Angrist and Jörn-Steffen Pischke, covers the empirical methods discussed in the class.
Some Important Topics:
- Selection bias in estimating labor supply curve, compensating wage differentials, return to schooling, etc.
- Simultaneity bias in estimating supply or demand
- Time, cohort and age effects; cross-sectional vs. panel data
- How to overcome biases in estimation; instrumental variable, difference-in-difference estimation, experimental design, treatment and control groups
References:
Labor Supply Estimation:
Labor Demand Estimation:
Equilibrium
Compensating Wage Differentials
Returns to Education
Income Inequality
Labor Mobility
Labor Market Discrimination
Labor Supply Estimation:
- Heckman, James J. "Sample Selection Bias as a Specification Error." Econometrica 47.1 (1979): 153-161.
Labor Demand Estimation:
- Hamermesh, Daniel S., and Stephen J. Trejo. "The demand for hours of labor: Direct evidence from California." Review of economics and statistics 82.1 (2000): 38-47.
- Card, David, and Alan B. Krueger. "Minimum Wages and Employment: A Case Study of the Fast-Food Industry in New Jersey and Pennsylvania." American Economic Review 84 (1994): 772-793.
- Acemoglu, Daron, David H. Autor, and David Lyle. "Women, war, and wages: The effect of female labor supply on the wage structure at midcentury." Journal of political Economy 112.3 (2004): 497-551.
Equilibrium
- Card, David. "The Impact Of The Mariel Boatlift on the Miami Labor Market." Industrial and Labor Relations Review 43.2 (1990): 245-257.
- Angrist, Joshua D., and Alan B. Krueger. "Empirical strategies in labor economics." Handbook of labor economics 3 (1999): 1277-1366.
- Donald, Stephen G., and Kevin Lang. "Inference with difference-in-differences and other panel data." The review of Economics and Statistics 89.2 (2007): 221-233.
Compensating Wage Differentials
- Villanueva, Ernesto. "Estimating Compensating Wage Differentials Using Voluntary Job Changes: Evidence from Germany." ILR Review 60.4 (2007): 544-561.
Returns to Education
- Chetty, Raj, et al. "How does your kindergarten classroom affect your earnings? Evidence from Project STAR." The Quarterly Journal of Economics 126.4 (2011): 1593-1660.
- Duflo, Esther. "Schooling and Labor Market Consequences of School Construction in Indonesia: Evidence from an Unusual Policy Experiment." American Economic Review 91.4 (2001): 795-813.
- Angrist, Joshua D., and Alan B. Krueger. "Does compulsory school attendance affect schooling and earnings?." The Quarterly Journal of Economics 106.4 (1991): 979-1014.
Income Inequality
- Song, Jae, et al. Firming up inequality. No. w21199. National Bureau of Economic Research, 2015.
Labor Mobility
- Lubotsky, Darren. "Chutes or ladders? A longitudinal analysis of immigrant earnings." Journal of Political Economy 115.5 (2007): 820-867.
Labor Market Discrimination
- Holzer, Harry J., and Keith R. Ihlanfeldt. "Customer discrimination and employment outcomes for minority workers." The Quarterly Journal of Economics 113.3 (1998): 835-867.
Past Teaching
University Of Minnesota
Labor Economics, ECON 4531, Instructor: Fall 2014 (Evaluation Score: 4.31/6), Spring 2015(5.35/6), Fall 2015 (5.57/6), Spring 2016 (5.63/6), Fall 2016.
Introduction to Econometrics, ECON 4261: TA, Summer 2015(5.71/6). Topics covered:
Introduction to Macroeconomics, ECON 1102, TA: Fall 2012, Spring 2013.
Bilkent University
Introduction to Economics, ECON 101, TA: Spring 2018.
Introduction to Probability and Statistics, ECON 221, TA: Fall 2007.
Some Graphs from Labor Economics Class:
University Of Minnesota
Labor Economics, ECON 4531, Instructor: Fall 2014 (Evaluation Score: 4.31/6), Spring 2015(5.35/6), Fall 2015 (5.57/6), Spring 2016 (5.63/6), Fall 2016.
Introduction to Econometrics, ECON 4261: TA, Summer 2015(5.71/6). Topics covered:
- Finite sample properties of OLS and large sample theory
- GMM
- Panel data econometrics
- Time-series econometrics
Introduction to Macroeconomics, ECON 1102, TA: Fall 2012, Spring 2013.
Bilkent University
Introduction to Economics, ECON 101, TA: Spring 2018.
Introduction to Probability and Statistics, ECON 221, TA: Fall 2007.
Some Graphs from Labor Economics Class:
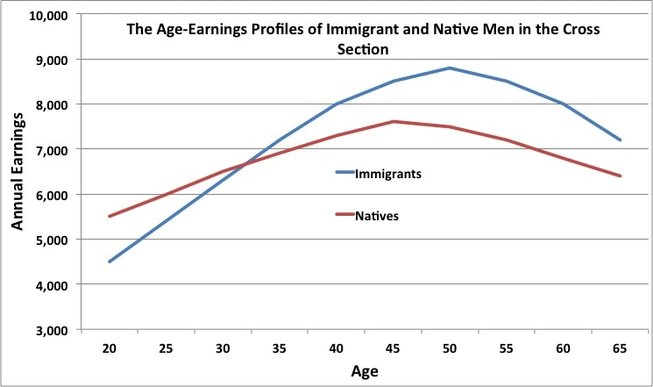
At first glance, it looks like immigrants' age-earning curve is steeper than the natives. Is this the case in reality? In this graph, there is a cohort bias due to cross-sectional data and also a selection bias since immigrants self-select to stay or return back. So, the truth can be the opposite of what you see.
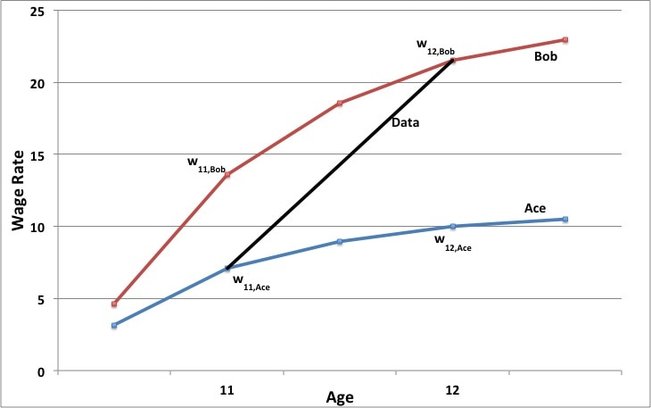
If one wants to estimate return to schooling, she is going to face a problem. Data shows the realization of the wage rates but not the counterfactuals. In the context of the left graph, Ace goes to school for 11 years and Bob for 12 years due to difference in the rate of return to education. Then, one can not know what would be the wage rate of Ace if he went to school for 12 years or the wage rate of Bob if he went to school for 11 years. This is ability bias due to self-selection. There are ways to eliminate this bias. Angrist and Krueger (1991) is a well-known example of using instrumental variable estimation to measure the return to schooling.
